Author: Davide Trimarchi — Head of Product & Design @123FormBuilder
- How I got started with data-driven development
Data-driven development is an increasingly popular way for technology companies to improve their products and services. All of the big tech giants already do data-driven development, but most smaller companies haven’t mastered it yet—and when smaller companies do turn to data, it’s often to improve their marketing efforts, not the product itself.
123FormBuilder’s leadership in data-driven development impressed me and led me to join the company last year. I was won over by the fact that decisions here are made on the basis of objective data, which encourages experimentation and lets us try many ideas quickly, instead of preparing for months to launch something. I was attracted to the company for these reasons, and my decision to join has paid off.
- Why data-driven development matters
So, what is a data-driven approach to development? It’s all about making decisions based on actual data that come from measuring user behavior, as opposed to decisions made on gut feeling and intuition alone. Perhaps surprisingly, many companies base a lot of their decisions on internal intuition instead of what users’ behavior is telling them. Managers embark on new projects or ideas based on what they think, not what they know, putting those projects at risk of failure. Without a data-driven approach, designers and developers are relegated to pleasing managers instead of users. Making decisions based on user data shifts the focus from what managers want to what users want, opening up a host of related benefits:
- Giving everyone a voice (including users!)
- Improving transparency: everyone, not just management, can access data
- Increasing ownership and autonomy
- Encouraging experimentation
- Allowing people to learn from mistakes
Armed with information about how their products and services are performing, companies can make better business decisions and improve internal operations, efficiency and morale.
- Our data-driven approach at 123FormBuilder
In the last two years, everyone at 123FormBuilder has started to adopt a data-driven approach in everything we do. Today, we track more than 800 unique metrics and use them for a variety of purposes, including:
- Understanding behavior of specific user segments: Looking at multiple data points for the same user segment helps you map, understand and improve the user journey. You can make sense of these metrics by looking at them in concert to understand your users’ needs and goals.
- Creating an early alert system: By continuously tracking the same metrics, you come to learn the normal ranges of variation in each metric. It’s easy to spot unusual highs or lows, and you can identify a problem early on and take action to fix it.
- Generating ideas for improvement: We use data to identify opportunities to improve a product. Data can tell us if our product is being used in unexpected ways, or if people find it difficult to do common tasks or generate specific workflows. This lets us make updates based on user needs.
- Setting accurate expectations: Without looking to data, it’s easy to get inflated expectations for a product update or new feature. We can use metrics to specify that we expect an update to increase engagement by a certain percentage within a specific cohort, or improve form completion rates by 10 percent. This allows us to not only set expectations for our product team, but also understand if an update has been successful. (If not, back to the dashboard—not the drawing board—to identify new opportunities based on data!)
- Budgeting for and prioritizing feature development in the product roadmap: When we know what we expect a feature to achieve, we also know what features are most important. Using clear expectations that are based on data allows us to prioritize the features that are expected to have the greatest impact on the bottom line.
- Validating updates before roll-out: We do A/B tests with a subset of users for every new feature before rolling it out to a wider audience. We compare the initial A/B test results to the expected impact to figure out whether the update should be released to everyone as-is, or if it still needs more work to achieve our goal.
- A closer look at A/B testing
While technology has made A/B testing easier to manage, especially at scale, the practice has actually been around for about 100 years. A/B testing is fairly simple: it shows two different versions of something (like an email subject line, landing page or product menu) to different sets of users to understand which version performs best. Although it sounds fairly simple, it can be difficult to execute well.
The most important part of A/B testing is deciding exactly what you want to test and how you will determine whether the test was successful. Too many companies test wildly different versions of a landing page, for example, with completely different headlines, layout, buttons and images. If one version of the page outperforms the other, you won’t know whether it was the headline, layout, buttons or imagery (or something else entirely) that made it work: you’ll have to do more testing to get actionable results. A better approach is to test one specific component at a time, such as button size (small or large?) or button color (green or red?), and decide what metric will determine which version “won” (typically, that’s the version that gets more clicks). The most effective A/B tests are conducted on a specific element with a specific target metric for success.
While testing is often a good idea, you don’t always have to test everything. If you have a small user base, your results may not be based on enough data to be conclusive. Or, you might not have enough time to conduct a test. In some cases, it’s okay to rely on common design patterns and industry best practices.
At 123FormBuilder, we do plenty of experiments: in the last two years, we’ve conducted 208 unsuccessful tests (indicating a feature needed improvement before wider release) and 66 successful tests (allowing a feature update to be rolled out to all users). In fact, we have 8 tests running right now. Throwing away code sucks, but we can see that under 25% of our experiments have actually succeeded. Imagine if we didn’t collect data and made updates based on gut feeling alone: we might have pushed the other 75% of updates to our users and actually hurt our performance!
To learn a little more about how A/B testing works, let’s look at two recent A/B tests we conducted on the dashboard of our form editor: one successful and one unsuccessful.
Example 1: Landing page alternative – unsuccessful
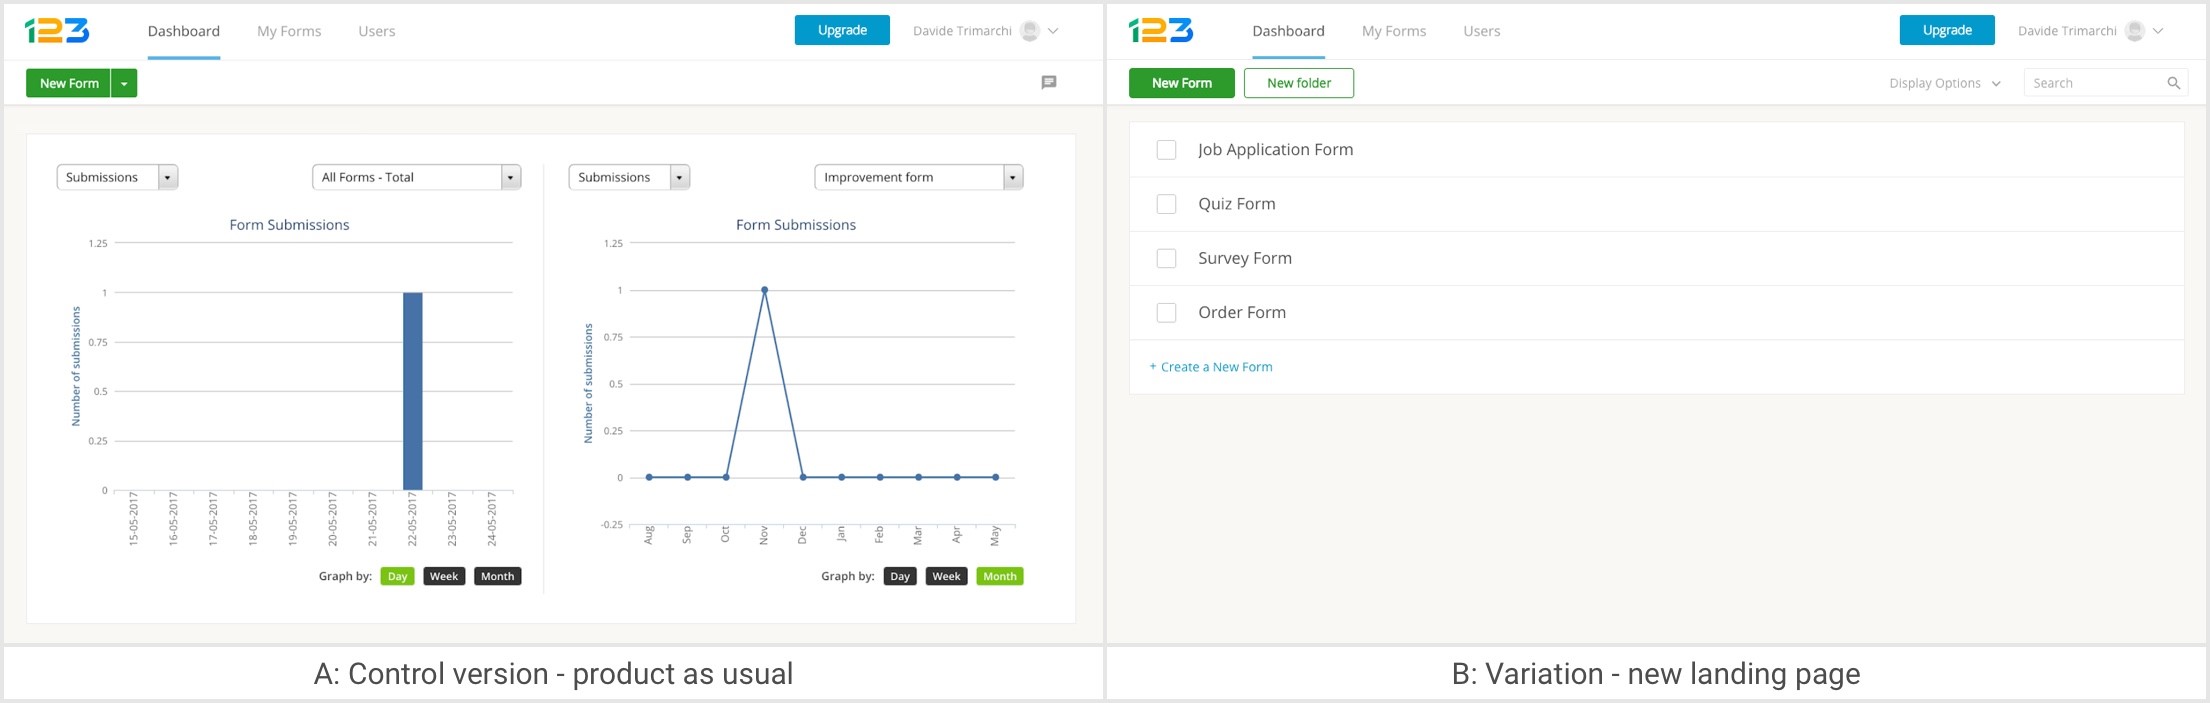
Hypothesis: We thought that our form editor landing page, a dashboard showing all of a user’s forms, was not encouraging users to interact with their existing forms or create new ones. We decided to test the current dashboard against a new landing page design where users would simply see a list of their forms. We expected that the new design would lead users to create more new forms and engage more with existing ones.
- Proposed update to test: List of user’s forms as landing page for form editor
- A: Control version – product as usual
- B: Variation – new landing page
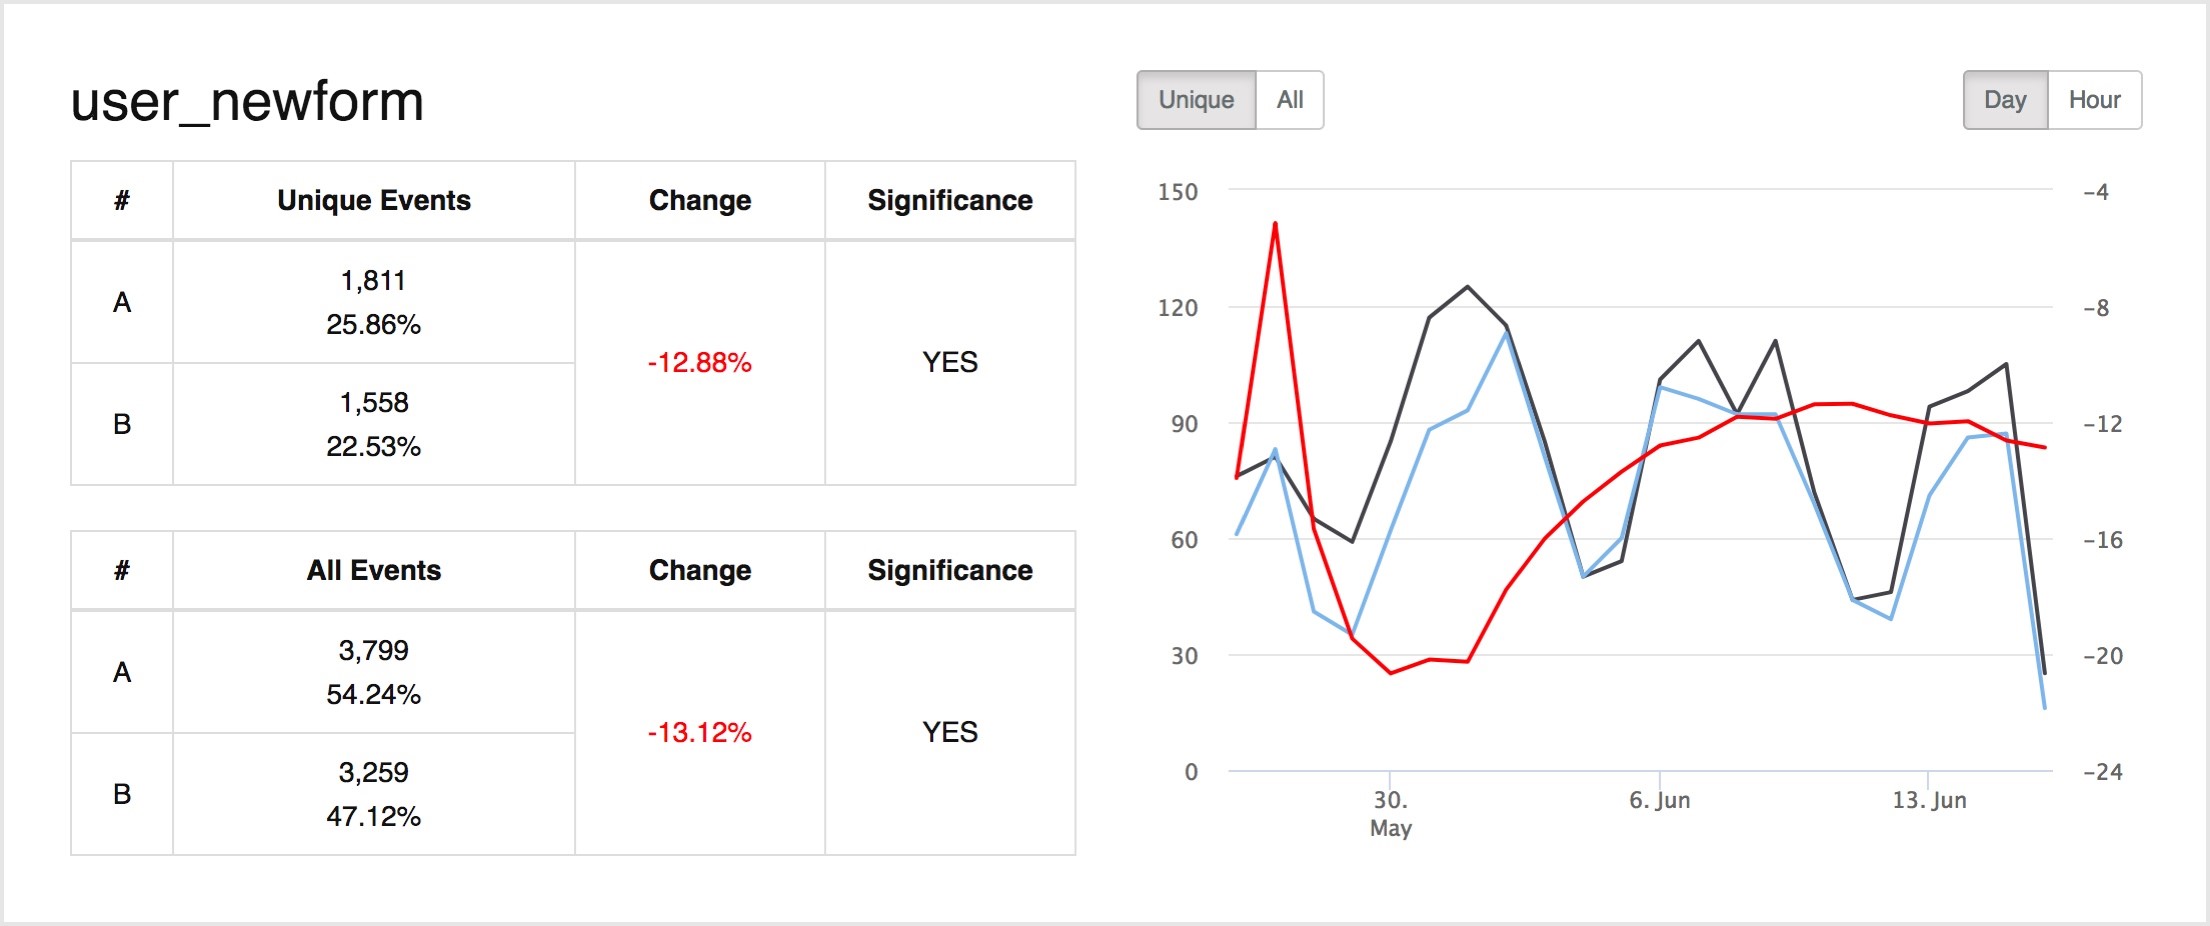
- Success metric: Number of new forms the user creates
- Results: The number of new forms created dropped by 13.12% (statistically significant) in the test design. We didn’t roll out the change.
Example 2: Dashboard update – successful
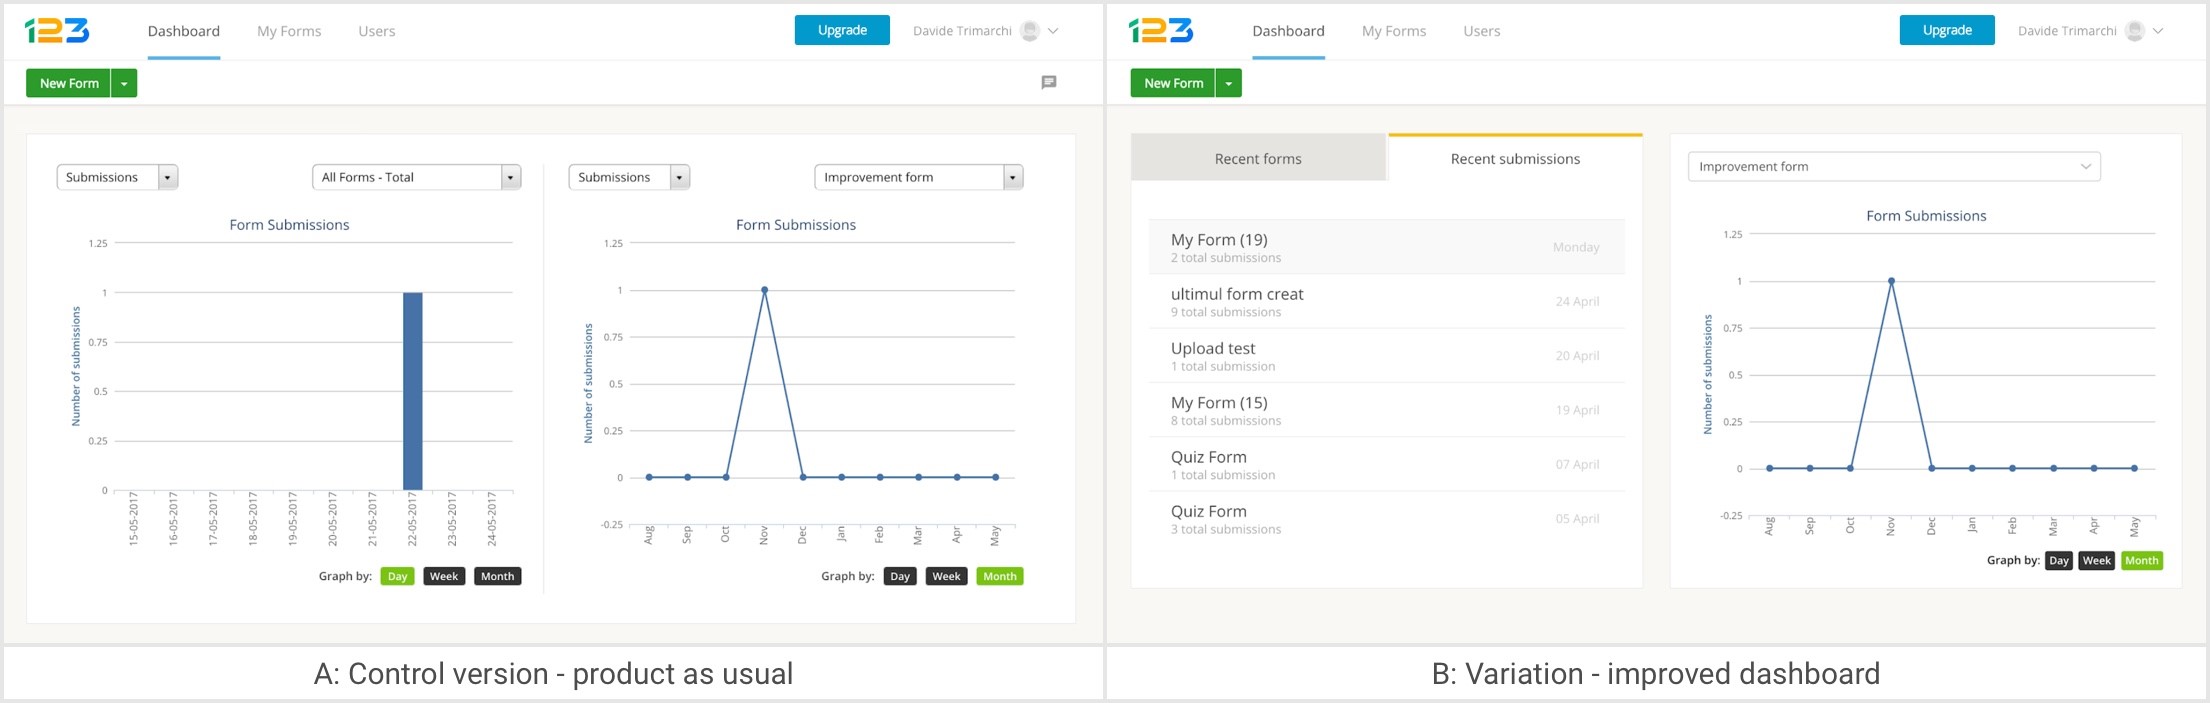
Hypothesis: We thought that our form editor’s dashboard wasn’t encouraging product navigation enough. The page only contained graphs showing the results of form submissions. We wanted to test a new dashboard that added quick links to recently created forms and forms with recent submissions next to the complete listing of submission data.
- Proposed update to test: A quick links panel next to form submission data
- A: Control version – product as usual
- B: Variation – improved dashboard
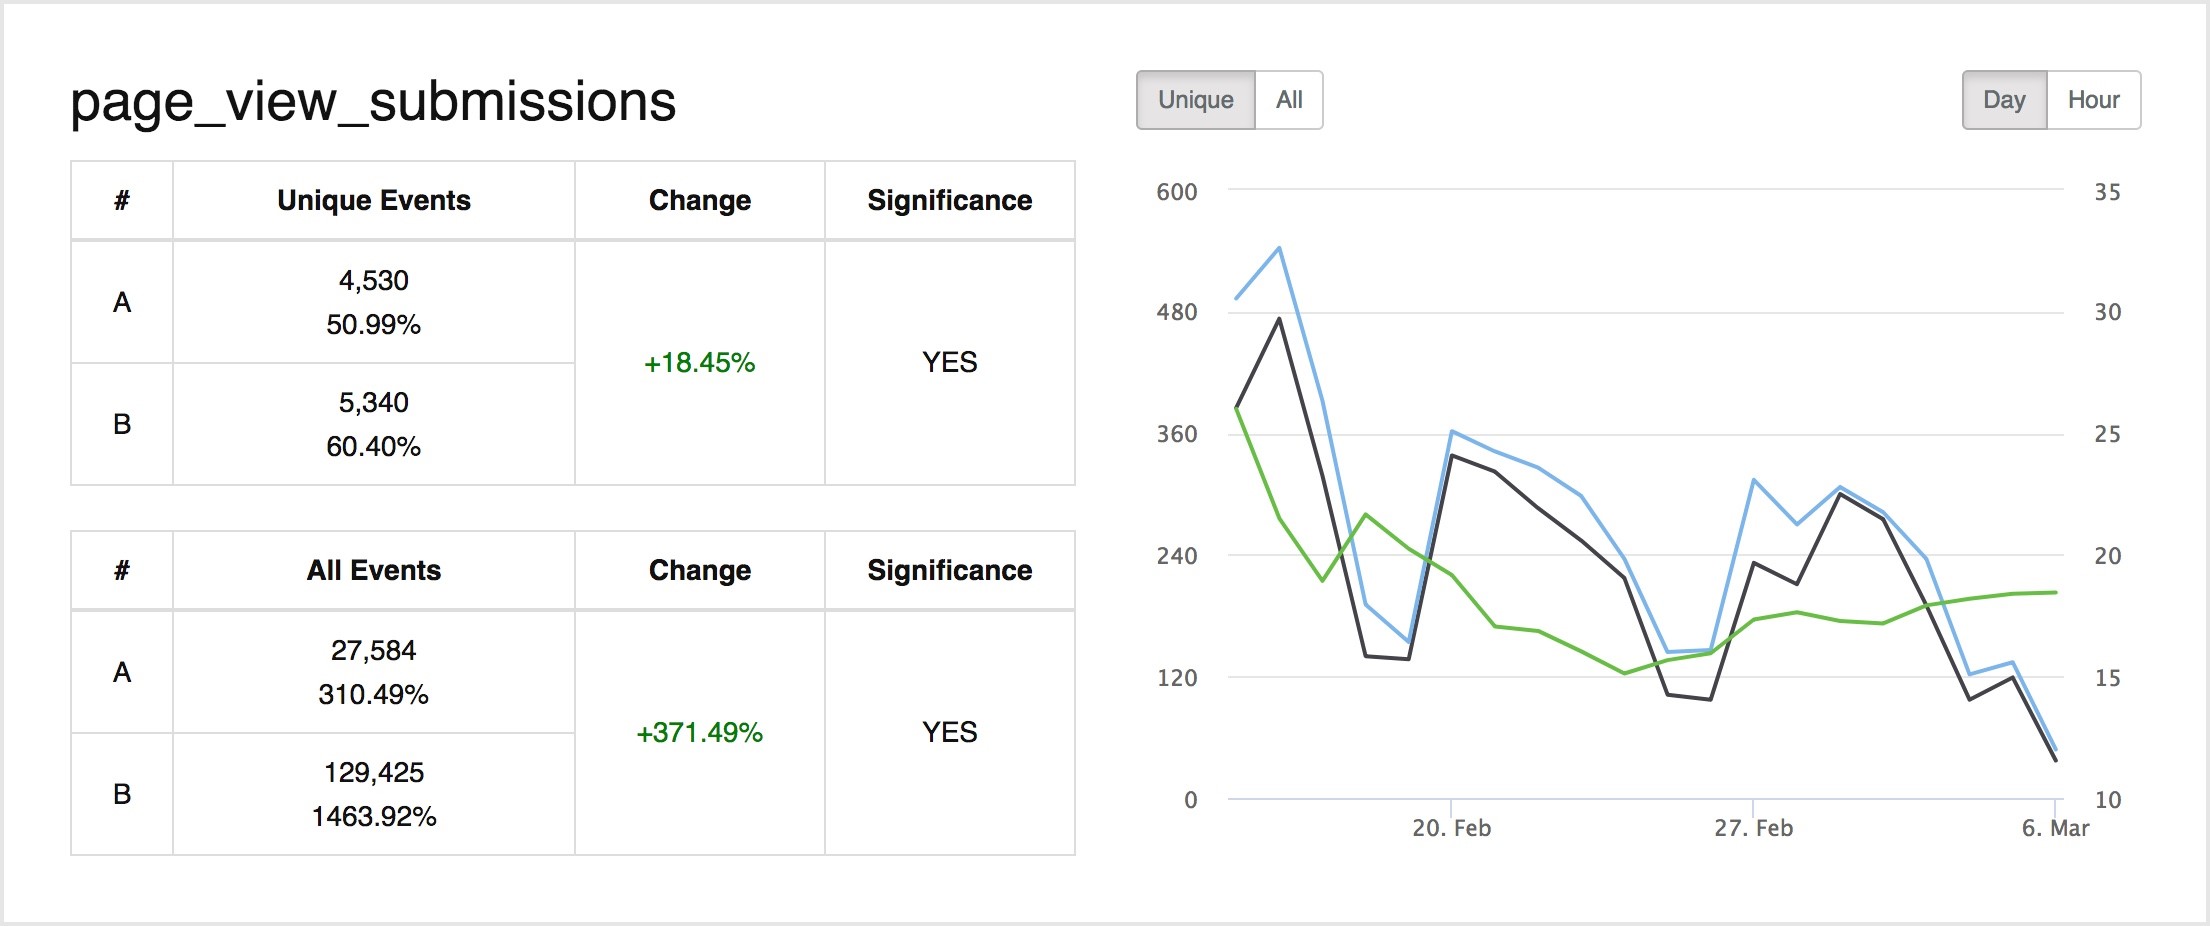
- Success metric: Number of times users viewed form submissions.
- Results: The number of form submission page views increased by 371.49% (statistically significant). We rolled out this update to our entire user base.
Sometimes, your A/B tests don’t provide conclusive or statistically significant results. That happened to us when we redesigned the paywalls in our platform. At that point, you can choose to throw away the code, which you might do if it adds unnecessary complexity that could become expensive to maintain in the future, or keep the code if it offers another benefit. We decided to keep our new paywalls because they reduced the time it would take to for us add new paywalls and reduced loading time on the website for users. Even though this redesign didn’t result in any significant performance improvements right away, it was still worth implementing.
- Conclusion – Key Learnings
What have we learned from two years of data-driven development at 123FormBuilder? Making data-driven decisions really works—as long as you keep these principles in mind:
- Test one element at a time (small steps)
- Establish the right goals and choose success metrics carefully
- Keep the number of metrics reasonably low for each experiment
- Make sure tracking is correct and metrics are recorded correctly by your system
- Look for large opportunities: test areas with the most room for improvement in user behavior
- Run tests for full business cycles: don’t end tests too quickly, or you might not capture the full diversity of users
- Only consider statistical significance: don’t make conclusions based on raw numbers, even if they “look good.” Test for significance and use that as the basis for your decisions.
Once you choose to move from gut-based decisions towards data-based decisions, you need to embrace the data and trust it above all else. Otherwise, you’re not really making data-driven decisions at all.